How do each of Illinois' 11 regions and several counties across the Chicago area compare when it comes to key coronavirus metrics?
Dive into the most important data with this searchable tool that shows some of the numbers health experts examine when making decisions about potential restrictions and other efforts to slow the pandemic's spread.
Updated every evening, this chart shows the number of cases each county or region has reported in the last seven days and its total number of cases since the pandemic began.
The chart also shows each area's current positivity rate in testing, as well as two important figures adjusted for population: the total number of cases per 100,000 people, as well as the rolling average daily new case count per 100,000 people over the previous seven days.
Public health experts say that latter figure is considered the norm to examine any trendline and could signal a "hot spot" for spread of the virus. It's also the threshold that some local and state officials are using to determine which states should be placed on any list for which travelers are required to quarantine when entering their jurisdiction.

If a state's 7-day average new case count per 100,000 people is over 15, both Chicago and Cook County require anyone entering the area from that state to quarantine for 14 days. That currently applies to 19 states, including Wisconsin and Missouri, as well as Puerto Rico.
Some states, like Connecticut, New Jersey and New York, use the same formula but with even tougher restrictions, requiring that same isolation period for anyone coming from states with more than 10 average daily new cases per 100,000 people. That includes Illinois, where that figure stands at 13.7 as of Wednesday.
This chart also shows the metrics for three states overall - Illinois, Indiana and Wisconsin - at the top to allow for easy analysis of how a particular region or county is faring in comparison with the rest of the state.
Gov. J.B. Pritzker said Wednesday that several of Illinois' 11 health care regions are reporting increases in their positivity rates, warning that the state is at a "make or break moment" in the fight against coronavirus.
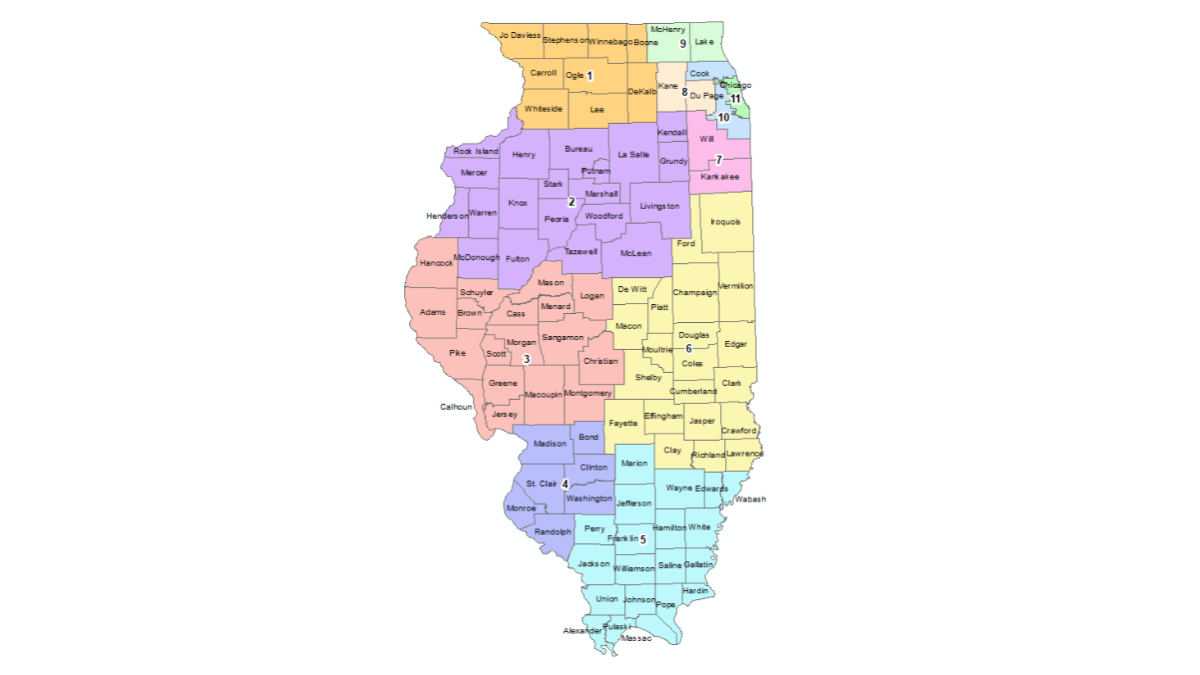
The governor announced last month that the state had been further divided from four into 11 separate regions to allow health officials to apply a more focused approach to each area's coronavirus response and potential restrictions as the pandemic continues.
If a region hits three consecutive days of an 8% average positivity rate, or sees a sustained increase in both positivity rate and hospital admissions, additional mitigations will automatically be put in place on a three-tiered plan, state health officials said in announcing the new approach.
The regions seeing increases in positivity rates as of Wednesday were regions 2, 3, 4, 7, and 9. You can find each region and county's specific metrics by scrolling through all eight pages, or searching in the box at the top left of the chart.