

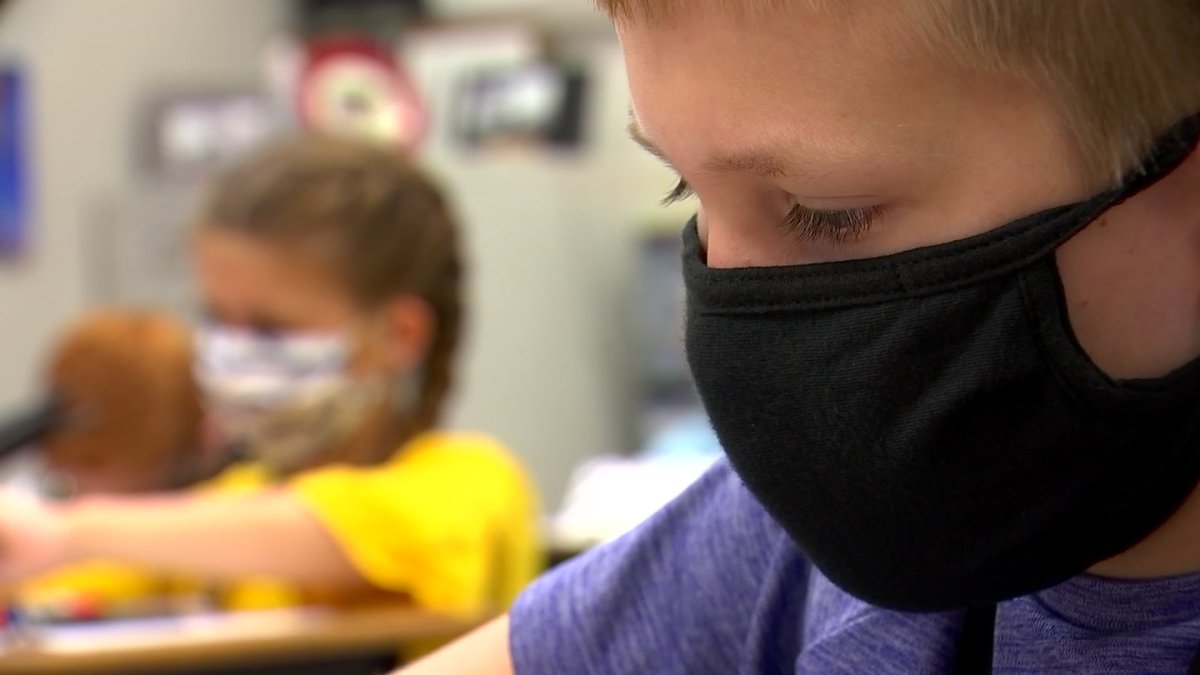
With COVID outbreaks being reported at a number of schools in Illinois, some are expressing concerns and the Chicago Teachers Union is pushing for increased safety protocols. Lauren Petty reports.
Health care regions in Illinois are seeing a mixed bag in terms of COVID metrics, with some regions reporting improvements in areas like positivity rates and hospitalizations, while others continue to see declines in ICU bed availability.
According to the Illinois Department of Public Health, there are currently three regions that are seeing positivity rates of 8% or higher, which under previous COVID mitigation plans would have triggered additional restrictions.
In Region 5, located in the southern tip of Illinois, the positivity rate remains on the rise, currently sitting at 11%. That region is also seeing low ICU bed availability, with just seven of 84 ICU beds currently open to treat COVID patients.
In Region 6, located in east-central Illinois, the positivity rate has risen to 8.4% in recent days, and hospitalizations have increased on nine of the last 10 days.
Feeling out of the loop? We'll catch you up on the Chicago news you need to know. Sign up for the weekly Chicago Catch-Up newsletter here.
Some areas are seeing improvements in several key metrics, including Region 7, comprised of Will and Kankakee counties. There, the positivity rate has decreased to 6.4%, while the ICU bed availability has increased to 26%. Hospitalizations have also declined or remained steady on seven of the last 10 days.
Here are the latest numbers from around the state:
Region 1 (Northwest Illinois) –
News


Positivity Rate: 6.4% (decreasing)
ICU Bed Availability: 16% (increasing)
Hospitalization Trends: 8/10 days increasing
Region 2 (West-Central Illinois) –
Positivity Rate: 5.8% (stable)
ICU Bed Availability: 18% (decreasing)
Hospitalization Trends: 10/10 days increasing
Region 3 (West Illinois) –
Positivity Rate: 6.2% (increasing)
ICU Bed Availability: 18% (stable)
Hospitalization Trends: 8/10 days decreasing or stable
Region 4 (Southwest Illinois) –
Positivity Rate: 8.1% (decreasing)
ICU Bed Availability: 20% (decreasing)
Hospitalization Trends: 7/10 days decreasing or stable
Region 5 (South Illinois) –
Positivity Rate: 11% (increasing)
ICU Bed Availability: 6% (steady)
Hospitalization Trends: 9/10 days increasing
Region 6 (East-Central Illinois) –
Positivity Rate: 8.4% (increasing)
ICU Bed Availability: 18% (stable)
Hospitalization Trends: 9/10 days increasing
Region 7 (Will, Kankakee counties) –
Positivity Rate: 6.4% (decreasing)
ICU Bed Availability: 26% (increasing)
Hospitalization Trends: 7/10 days decreasing or stable
Region 8 (Kane, DuPage counties) –
Positivity Rate: 5.5% (increasing)
ICU Bed Availability: 21% (stable)
Hospitalization Trends: 9/10 days increasing
Region 9 (McHenry, Lake counties) –
Positivity Rate: 5.2% (decreasing)
ICU Bed Availability: 18% (increasing)
Hospitalization Trends: 9/10 days increasing
Region 10 (Suburban Cook County) –
Positivity Rate: 4.8% (steady)
ICU Bed Availability: 16% (decreasing)
Hospitalization Trends: 10/10 days increasing
Region 11 (Chicago) –
Positivity Rate: 4.2% (steady)
ICU Bed Availability: 16% (increasing)
Hospitalization Trends: 9/10 days increasing